


Modulation
| IQ | In-phase and Quadrature |
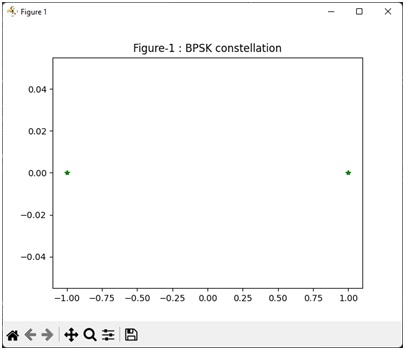
| BPSK | Binary Phase Shift Keying |
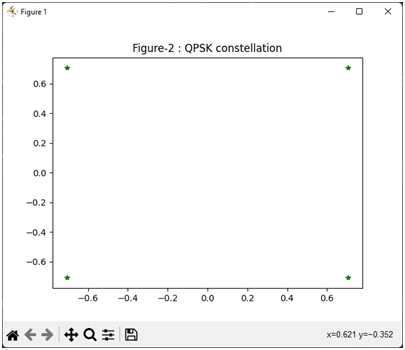
| QPSK | Quadrature Phase Shift Keying |
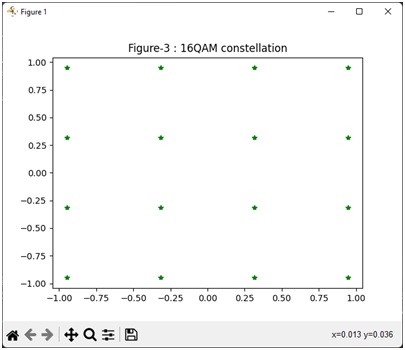
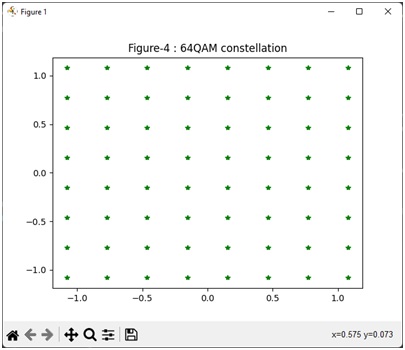
| QAM | Quadrature Amplitude Modulation |
Modulation Bits per Symbol
| BPSK | 1 |
| QPSK | 2 |
| 8 PSK | 3 |
| 16 QAM | 4 |
| 32 QAM | 5 |
| 64 QAM | 6 |
| 128 QAM | 7 |
| 256 QAM | 8 |
| 512 QAM | 9 |
| 1024 QAM | 10 |
| 2048 QAM | 11 |
| 4096 QAM | 12 |
Introduction
Digital modulation techniques such as QPSK, 16QAM and 64QAM helps in achieving bandwidth efficiency by mapping multiple bits on single carrier
Python Script – Modulation
# Binary data generator (1's and 0's as per user defined length)
import random
import numpy as np
import numpy
import matplotlib.pyplot as plt
# Python code to generate binary stream of data
input_data = ""
len1 = 1000 # length of input data
for i in range(len1):
  temp1 = str(random.randint(0, 1))
  input_data += temp1
print(input_data)
input_data1 = [int(i) for i in input_data] # convert string to list
print(input_data1)
# Setting up parameters such as modulation type, number of bits per carrier (nc) and norm_factor
modulation_type = int(input("Enter modulation type (0: BPSK, 1: QPSK, 2:16QAM, 3: 64QAM: "))
print(modulation_type)
norm_factor = [1.0, 0.7071, 0.3162, 0.1543]
nc = [1, 2, 4, 6]
k = norm_factor[modulation_type]
print(k)
mode = nc[modulation_type]
print(mode)
M0 = []
match mode:
case 1:
    M0 = np.array([1, -1])
    i = len(M0)
    b = np.zeros(i)
    for i in M0:
      M0 = numpy.multiply(M0, k)
    plt.plot(M0.real, M0.imag, "g*")
    plt.title("Figure-1 : BPSK constellation")
    plt.show()
case 2:
    M0 = np.array([1. + 1.j, -1. + 1.j, 1. - 1.j, -1. - 1.j])
    i = len(M0)
    b = np.zeros(i)
    for i in M0:
      N0 = numpy.multiply(M0, k)
    plt.plot(M0.real, M0.imag, "g*")
    plt.title("Figure-2 : QPSK constellation")
    plt.show()
case 4:
    M0 = np.array([1. + 1.j, 1. + 3.j, 1. - 1.j, 1. - 3.j, 3. + 1.j, 3. + 3.j,
    3. - 1.j, 3. - 3.j, -1. + 1.j, -1. + 3.j, -1. - 1.j, -1. - 3.j, -3. + 1.j,
    -3. + 3.j, -3. - 1.j, -3. - 3.j])
    i = len(M0)
    b = np.zeros(i)
    for i in M0:
      M0 = numpy.multiply(M0, k)
    plt.plot(M0.real, M0.imag, "g*")
    plt.title("Figure-3 : 16QAM constellation")
    plt.show()
case 6:
    M0 = np.array([3 + 3j, 3 + 1j, 3 + 5j, 3 + 7j, 3 - 3j, 3 - 1j, 3 - 5j,
    3 - 7j, 1 + 3j, 1 + 1j, 1 + 5j, 1 + 7j, 1 - 3j, 1 - 1j, 1 - 5j, 1 - 7j,
    5 + 3j, 5 + 1j, 5 + 5j, 5 + 7j, 5 - 3j, 5 - 1j, 5 - 5j, 5 - 7j, 7 + 3j,
    7 + 1j, 7 + 5j, 7 + 7j, 7 - 3j, 7 - 1j, 7 - 5j, 7 - 7j, -3 + 3j, 3 + 1j,
    -3 + 5j, -3 + 7j, -3 - 3j, -3 - 1j, -3 - 5j, -3 - 7j, -1 + 3j, -1 + 1j,
    -1 + 5j, -1 + 7j, -1 - 3j, -1 - 1j, -1 - 5j, -1 - 7j, -5 + 3j, -5 + 1j,
    -5 + 5j, -5 + 7j, -5 - 3j, -5 - 1j, -5 - 5j, -5 - 7j, -7 + 3j, -7 + 1j,
    -7 + 5j, -7 + 7j, -7 - 3j, -7 - 1j, -7 - 5j, -7 - 7j])
    i = len(M0)
    b = np.zeros(i)
    for i in M0:
      M0 = numpy.multiply(M0, k)
    plt.plot(M0.real, M0.imag, "g*")
    plt.title("Figure-4 : 64QAM constellation")
    plt.show()
# checking length of data to add padding zero at the end if required
remainder = len1 % mode
print(remainder)
if remainder != 0:
  remainder = mode-remainder
 input_data1 = np.pad(input_data1, (0, remainder))
len1 = len(input_data1)
len2 = int(len1/mode)
input_data_r = np.reshape(input_data1, (len2, mode))
print(input_data_r)

s1 = input_data
s2 = []
chunks = [s1[i:i+mode] for i in range(0, len(s1), mode)]
for piece in chunks:
  temp = int(piece, 2)
  print(temp, piece)
  s2.append(temp)

map_out = []
for value in s2:
  map_out.append(M0[value])
  print(M0[value])
Input Modulation
0: BPSK, 1: QPSK, 2:16QAM, 3: 64QAM
Output Plot